
 MindPlot
你的专属科学家助理
从原始数据清洗、统计分析、科学建模到发表级专业图表、学术作图、研究报告,AI 一站式搞定。

MindPlot 提供
美观、适合出版的科学图表
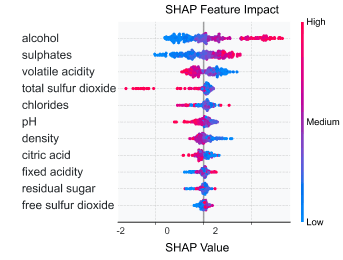
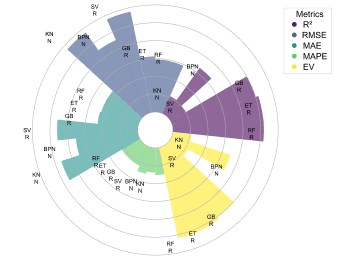
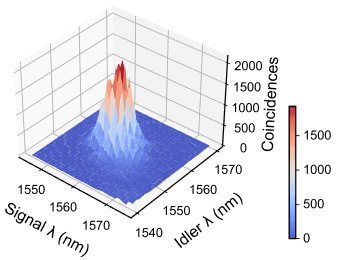
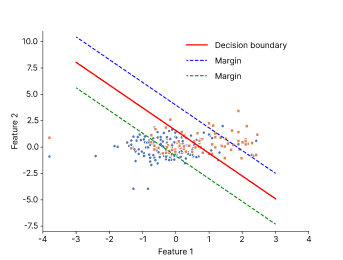
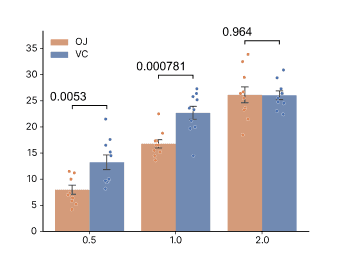
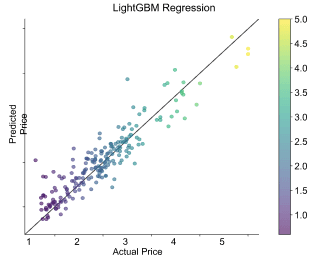
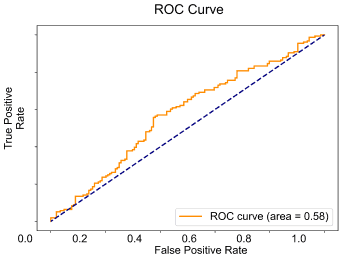
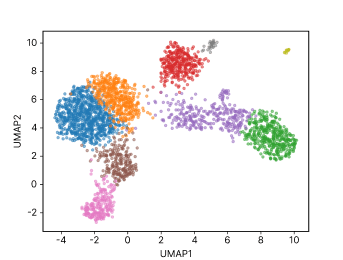
MindPlot 特性
与您的数据交谈
用于自然命令的对话式人工智能。 无需编码。
自动数据清理
立即修复缺失值、异常值
即时调整
立即更改字体、颜色、比例
AI 能力
更智能。 人工智能理解你。
输入任何格式
图像、Excel、CSV
灵活导出
位图(png、jpg)、矢量(svg、pdf)
完整的统计报告
自动生成包含方法和结果的 Word/PDF
代码导出
下载 Python 代码以验证分析
MindPlot 科研博客
观点、方法与证据。
如何用 Aeon 分析时间序列:DTW 分类、聚类与相似度计算
Aeon 提供了一套面向时间序列的 Python 工具,可以在保留观测顺序的前提下比较曲线、识别类别并探索分组。下面的例子从六条容易核对的短曲线出发:DTW 最近邻模型判断两条未参与训练的曲线是上升还是下降,时间序列 k 均值恢复两个趋势组,距离计算则解释相似曲线与相反曲线为何会被区别对待。两条留出曲线都得到正确分类;两条相似上升曲线的 DTW 距离是 0.06,上升曲线与下降曲线之间的距离是 70.0。这些结果适合验证分析流程是否真正工作,但六条刻意简化的曲线不能代表模型在真实传感器、临床或实验数据上的准确率。
阅读文章 →02如何用 Dask DataFrame、Array、Delayed 与 Distributed 分析分区科学数据
可复现的 Dask 工作流能够惰性读取分区测量数据,执行筛选和分组汇总,写出分区 Parquet 数据集,变换分块数值数组,并求值具有明确依赖关系的任务图,而不必把所有中间数据同时塞入内存。经过验证的演示中,三个 CSV 分区共包含 12 行,value 总和为 306。按 value = 18 筛选后,control 的计数、和、均值分别为 4、96、24.0;treated 分别为 6、186、31.0。另一个 6 × 8 分块数组得到从 33.5 到 44.0 的八个列均值;六个延迟平方任务之和为 91。Dask 2026.3.0 在保留的第 5 次尝试中完成这些功能。由于聊天沙箱不允许
阅读文章 →03如何使用 Python、psutil 与可复现系统清单检测科学计算资源
开展科学计算之前,最重要但经常被忽略的一步,是先测量真正执行任务的机器,而不是根据设备型号、云主机名称或经验猜测可用资源。本次经过完整验证的实例检测到:Linux x8664 主机拥有 8 个物理 CPU 核心、16 个逻辑核心、31.06 GiB 总内存、16.06 GiB 当前可用内存、103.12 GiB 项目文件系统可用空间,并且没有检测到可用 GPU 加速器。原生检测器给出的并行上限建议为 14 个工作进程;结合内存和 I/O 风险,更稳妥的操作建议是从 8–12 个工作进程开始,再依据真实负载逐步扩展。
阅读文章 →04如何用可复现的 Hugging Face 目录检索寻找生物学机器学习模型
直接答案:本次经过验证的在线目录检索找到九十五条生物学相关模型记录,生成四万一千九百一十二字节的 JSON 快照和二千五百八十七字节的 Markdown 推荐报告;测试没有下载、运行、基准评测或背书任何模型。
阅读文章 →05如何使用 GNU Octave 求解并审计 MATLAB 兼容的线性代数流程
GNU Octave 将线性方程组求解为 x=[2,3],并独立核验该预期向量。5个信号观测的均值为6,样本标准差为6.59545297913646。流程保留了MATLAB兼容的MAT工作区以及栅格和矢量图。。该结果在保留的第11次尝试中通过原生执行、真实聊天端到端执行和语义产物验证,只能在本演示的数据、方法和限制范围内解释。
阅读文章 →06如何使用 Matplotlib 创建可发表的多面板科学图
流程读取6条测量记录,使用Matplotlib面向对象接口创建两个坐标轴,并绘制折线、误差棒、散点、注释与图例。输出为1823×1223像素、200 dpi的PNG,以及保留可编辑文字的SVG。。该结果在保留的第9次尝试中通过原生执行、真实聊天端到端执行和语义产物验证,只能在本演示的数据、方法和限制范围内解释。
阅读文章 →07如何使用 PennyLane 自动微分计算量子线路梯度
直接结论。 在 θ = 0.432 弧度时,线路1上的 Pauli-Z 期望值为0.908130190694961。PennyLane 自动梯度为−0.4186878989752795,解析值−sin(θ)为−0.41868789897527947,绝对误差仅5.55 × 10⁻17。。该结果在保留的第5次尝试中通过原生执行、真实聊天端到端执行和语义产物验证,只能在本演示的数据、方法和限制范围内解释。
阅读文章 →08如何使用 Qiskit 构建、转译并验证贝尔态实验
科学原理导论 贝尔态实验是能够展示双量子比特非经典关联的最小工作流之一。电路从计算基态 |00〉 出发,先在第一个量子比特上施加 Hadamard 门,再以第一个量子比特为控制端、第二个量子比特为目标端施加受控 X 门。在理想电路模型中,这两步得到 (|00〉 + |11〉)/√2。测量不会返回“半个状态”,每次 shots 只产生普通比特串;重复测量后,00 与 11 应各占大约一半,而无噪声态矢量模拟中的 01 和 10 应保持零计数。
阅读文章 →09如何使用 QuTiP 模拟阻尼谐振子并验证光子数衰减
科学原理导论 开放量子系统会与环境交换能量或信息,因此一般不能只用封闭系统的薛定谔方程描述。常见的 Markov 近似采用 Lindblad 主方程,让密度算符在 Hamiltonian 和耗散 collapse terms 共同作用下演化。对于零温阻尼谐振子,与湮灭算符成比例的 collapse operator 会持续移除激发;如果初始状态是含五个光子的 Fock 态,并且衰减常数约定一致,平均光子数应遵循 n(t)=n0 exp(-κt)。
阅读文章 →10如何使用 Psi4 计算电子反应能并比较基组影响
科学原理导论 反应能把分子电子结构与化学变化联系起来。在最基础的量子化学层面,电子反应能是产物与反应物电子能量按照化学计量数加权后的差。公式虽然很短,可信计算却必须同时满足多项条件:反应式元素守恒,每个分子的电荷和多重度正确,坐标来源明确,所有物种采用一致的电子结构方法,自洽场确实收敛,单位转换透明,并且报告准确说明该数值代表什么、不代表什么。
阅读文章 →11如何使用 GFN2-xTB 计算垂直电离势与电子亲和能
科学原理导论 氧化和还原涉及移除或加入电子,但任何计算得到的“氧化还原数值”只有在电子状态定义与热力学范围明确时才有意义。电离势描述移除电子的能量代价,电子亲和能描述加入电子的能量变化。垂直量在中性分子的几何构型上评估带电状态,而绝热量允许离子结构弛豫。气相能量差也不同于溶液中相对于参比电极的电势。
阅读文章 →12如何制定经过证据审计的 NSF 科研基金申请规划包
直接结论。 运行生成了7份规划产物。审计将三年项目周期、直接成本总额和目标数量与输入逐项核对,明确标记 submissionready 为 false,并将无依据主张扫描结果记为 passwithflags,保留需要项目负责人和机构复核的问题。。该结果在保留的第3次尝试中通过原生执行、真实聊天端到端执行和语义产物验证,只能在本演示的数据、方法和限制范围内解释。
阅读文章 →13如何为小麦微塑料与干旱研究构建可证伪科学假设
直接结论。 验证档案保留12周周期、4个生长室和12,000美元预算上限,生成7项机制不同且明确标注为探索性的假设、4项跨学科联系和6项受挑战假设,并依据考虑生长室效应的决策规则优先选择3项思路。该结果在保留的第3次尝试中通过原生执行、真实聊天端到端执行和语义产物验证,只能在本演示的数据、方法和限制范围内解释。
阅读文章 →14如何批判性评价存在失访与结局转换的预防性随机试验
直接结论。 在纳入分析者中,Supplement X 组感染风险为12/42即28.57%,对照组为18/56即32.14%,绝对风险差为−3.57个百分点;由于差异性失访、分配隐藏不清、参与者和评价者未盲以及数据收集后更换注册主要结局,验证评价将证据确定性评为极低,不能确立预防效果。该结果在保留的第5次尝试中通过原生执行、真实聊天端到端执行和语义产物验证,只能在本演示的数据、方法和限制范围内解释。
阅读文章 →15如何用 Matplotlib 和 Seaborn 制作可发表的剂量—反应科学图
这套经过验证的双面板剂量—反应工作流,从四个剂量水平生成了 300 DPI 的 PNG 和可编辑 SVG。在 4 µM 终点,control 为 90%,treated 为 43%,两者相差 47 个百分点。最终图使用 Matplotlib 3.10.5、Seaborn 0.13.2、明确指定的 DejaVu Sans 字体栈、对色觉缺陷较友好的蓝色与橙红色组合、误差棒、面板标签以及无边框图例。保留的第 8 次尝试在 Linux x8664 CPU 环境中通过了软件包安装、原生绘图、自然语言聊天执行和产物语义验证。这个结果证明所演示的可复现绘图流程能够工作,但不能据此宣称处理有效,也不能代替统
阅读文章 →16如何使用 SHAP、TreeExplainer、蜂群图、依赖图与瀑布图解释随机森林预测
科学原理导论 预测模型可能具有不错的精度,却仍然难以审查。随机森林把许多决策树的结果取平均,每棵树又包含不同变量、阈值与交互关系,因此阅读一棵树不能代表整个模型。模型解释方法处理的是一个比因果科学更窄的问题:在已经拟合的预测函数和明确的参考约定下,怎样把某一次预测相对于基线的变化分配给输入特征?SHAP 以合作博弈论中的 Shapley 值为基础,为这个问题提供统一的数学框架。
阅读文章 →17如何使用 SimPy 模拟单服务台排队系统:离散事件仿真与等待时间分析
四位顾客分别在仿真时刻 0、1、2、3 到达一个容量为一的服务台,每次服务固定耗时两个时间单位。真实运行 SimPy 4.1.1 后,等待时间依次为 0、1、2、3,平均等待时间为 1.5,最大等待时间为 3,最后一位顾客在时刻 8 完成服务。以上数值已经通过原生程序执行、自然语言对话执行、CSV 结构检查以及独立语义校验。这个小型确定性案例既能人工逐项复核,又确实覆盖 Environment、Resource、生成器进程、资源请求和 timeout 等 SimPy 核心机制,因此适合作为离散事件仿真的可复现入门范例。
阅读文章 →18如何使用 Psi4 TD-SCF 计算电子激发与紫外可见棒状光谱
科学原理导论 电子吸收光谱研究分子电子态之间的跃迁。线性响应含时方法在固定核几何构型上估计垂直激发能和跃迁强度。把能量换算为波长便于可视化,但计算得到的垂直棒线并不自动等于实验谱带峰值。理论方法、基组、几何、溶剂、振电结构、激发态性质和展宽都会影响与实验的比较。
阅读文章 →19如何对组合分子库运行 Thompson Sampling 贝叶斯采样
科学原理导论 Thompson Sampling 是在不确定性下进行序贯决策的概率匹配策略。流程为每个行动或组分维护后验分布,每轮从后验抽取一个可能值,并评估该抽样世界中最有利的行动。反复执行后,它会在利用高估计回报与探索高不确定性选项之间取得平衡。在组合化学中,行动可以是试剂选择,回报可以来自实验或评分函数。
阅读文章 →20如何使用 PyTorch Geometric 训练并验证图卷积网络
科学原理导论 图神经网络通过沿边传播信息,把节点属性与邻居信息组合为学习表示。图卷积网络反复聚合邻居特征、应用可训练变换,并生成可用于节点、边或整图预测的嵌入。评估特别容易发生泄漏,因为边会连接训练节点和留出节点,而且合成社区结构可能让标签异常容易恢复。
阅读文章 →常见问题解答
什么是 MindPlot?它是如何工作的?
MindPlot 无需编程即可将复杂的数据集转换为可供发表的绘图。上传您的数据,描述您想要的内容,一键获取专业的可视化效果。
使用 MindPlot 需要具备编程技能吗?
无需编码! 我们的对话界面可让您使用自然语言创建复杂的可视化效果,非常适合任何技能水平。
MindPlot 有何不同?我可以自定义作图吗?
我们独特的多代理系统可实现实时绘图定制,而无需缓慢的重新处理。 通过我们的对话界面立即调整样式、颜色和布局。
What chart and plot types can MindPlot make?
MindPlot generates publication-ready scientific charts of every kind — Kaplan-Meier survival curves, meta-analysis forest plots, volcano plots, correlation-matrix heatmaps, ROC curves, box, violin and beeswarm plots, regression, scatter and PCA plots, and more. Just upload a CSV and describe what you need.
我的数据安全吗? 你用它来训练模型吗?
您的数据隐私是我们的首要任务。我们不会使用您的数据来训练我们的模型。所有处理过程都是安全和保密的。
MindPlot® AI Scientific Data Toolkit
MindPlot® is an AI co-scientist for the entire research workflow — read, analyze, write, visualize, and present. Our unified suite (MindReader, MindChat, MindSheet, MindWriter, MindPlot, MindChart, MindDraw, MindFlow, MindVector, MindSlide, MindNote) helps researchers go from papers and raw data to publication-quality results in one place.
The Complete AI Research Suite
- MindReader: AI paper reader and literature summarizer — upload PDFs to summarize methods, extract findings, and translate.
- MindChat: One AI chat for ChatGPT, Claude, Gemini, and DeepSeek — switch models mid-conversation, pay per token.
- MindSheet: AI spreadsheet to clean, transform, and analyze research data with natural language — no formulas required.
- MindWriter: AI academic writing assistant for drafting papers, grants, and latex manuscripts.
- MindPlot: Publication-quality scientific static plots (Matplotlib/Seaborn) with APA/Nature styling — Kaplan-Meier survival curves, forest plots, volcano plots, heatmaps, box & violin plots, and more.
- MindChart: Interactive data exploration charts (ECharts) for presentations and web sharing — correlation matrix heatmaps, ROC curves, regression and time-series plots.
- MindDraw: Scientific illustration generator for graphical abstracts and mechanism diagrams.
- MindFlow: AI diagramming tool for research workflows, process maps, and experiment logic.
- MindVector: AI vector graphics editor for figures, scientific diagrams, and editable SVG artwork.
- MindSlide: AI presentation maker for academic talks, lab meetings, and thesis defense slides.
- MindNote: AI knowledge hub that captures and links your papers, chats, and figures into a searchable second brain.
Key Capability: Publication-Ready Scientific Visualization
- Automated statistical analysis (t-test, ANOVA) integrated with visualization
- High-DPI exports (300dpi+) for journal submission (PDF, SVG, PNG, EPS)
- Strict adherence to academic styling guidelines (APA, Nature, Science)
Scientific Chart & Plot Types We Generate
Describe your data and MindPlot's AI builds the exact chart you need: Kaplan-Meier survival curves and survival-plot generators, meta-analysis forest plots, volcano plots for differential expression, correlation-matrix heatmaps, ROC curves, box, violin, beeswarm and density plots, regression and scatter plots, PCA plots, dendrograms, and confusion matrices — all publication-ready, no coding.
- Kaplan-Meier survival curve generator (survival analysis, log-rank)
- Forest plot maker for meta-analysis and effect sizes
- Volcano plot generator for RNA-seq and proteomics
- Heatmap and correlation-matrix generator (CSV to heatmap)
- Box, violin, and beeswarm plots with built-in statistical tests
- ROC curves, regression plots, and confusion matrices
- CSV to chart in one click — upload data, get a figure
Trusted by Scientists Worldwide
- 学术研究和科学出版物
- 生物医学和药物研究
- 环境科学和气候研究
- 社会科学和心理学
- 工程技术分析
- 商业情报和市场研究
- 质量控制和制造
- 财务分析和报告
关于Cosinx AI
Developed by Cosinx AI, a leading artificial intelligence company specializing in scientific visualization and drug discovery. Our mission is to democratize data science and make advanced analytics accessible to researchers and professionals across all disciplines.


