
Table of contents
- Scientific introduction
- Test progress
- Demo user request
- Demo data
- Validated workflow
- Results and artifacts
- What attempts 1–5 taught us
- Scaling the workflow responsibly
- Reproducibility
- Limitations
- References
- Try this workflow
A reproducible Dask workflow can read partitioned measurements lazily, filter and aggregate them, write a partitioned Parquet dataset, transform a chunked numerical array, and evaluate an explicit task graph without forcing all intermediate data into memory. In the validated example, three CSV partitions contained 12 rows with a total value sum of 306. Filtering at value >= 18 produced control count 4, sum 96, mean 24.0 and treated count 6, sum 186, mean 31.0. A separate 6 × 8 chunked array produced eight column means from 33.5 to 44.0, while six delayed square tasks summed to 91. Dask 2026.3.0 completed these functions in retained attempt 5; the restricted chat sandbox used the threaded scheduler for the six gathered square values because local scheduler socket creation was unavailable.
Scientific introduction
Why partitioned computation matters
Scientific datasets often grow by acquisition event rather than arriving as one clean table. A microscope may write one file per field, a sensor network may emit one file per hour, and a simulation campaign may create one result per parameter combination. Concatenating everything into a single in-memory object can become slow, fragile, or impossible. Partitioned computation instead treats the dataset as a collection of independently readable pieces and delays work until a result is requested. This design can reduce peak memory, expose parallelism, and make a processing plan inspectable before expensive execution.
Dask extends familiar Python interfaces with task graphs. A Dask collection generally represents a recipe rather than a completed result. Reading several CSV files constructs partitions and metadata; filtering creates new graph layers; grouping adds shuffle or aggregation tasks; and compute() asks a scheduler to execute the necessary graph. This distinction between graph construction and execution is central. A notebook cell that returns instantly may only have described work, while a later reduction triggers I/O and computation. Reliable scientific reporting should therefore distinguish the lazy object from the materialized result.
Task graphs are directed acyclic graphs whose nodes represent operations and whose edges represent dependencies. Independent nodes may execute concurrently, while dependent nodes wait for their inputs. Graph execution does not automatically make a poorly designed analysis efficient. Very small tasks can create excessive scheduling overhead, very large partitions can exceed memory, and unnecessary shuffles can dominate runtime. Partition sizes, data types, graph topology, and scheduler choice remain scientific-computing design decisions that should be measured on representative data.
Dask DataFrame and tabular evidence
Dask DataFrame provides a partitioned interface modeled on pandas. It is useful when a dataset is larger than comfortable memory or when many files can be processed in parallel. Its API intentionally does not reproduce every pandas behavior: operations must be expressible across partitions, and global ordering or arbitrary row-wise logic can be expensive. Metadata about column names and types allows Dask to plan many transformations without immediately loading every row.
The demonstration uses three small CSV files so every value can be reviewed. Dask reads them using a glob, yielding three logical input partitions. It filters rows whose value is at least 18 and groups the retained rows by category. The grouped output is small, so it is materialized as a two-row CSV. The complete unfiltered input is also written to partitioned Parquet and read back to verify 12 rows and total 306. This round trip exercises ingestion, a lazy expression, grouped reduction, materialization, columnar serialization, and reconstruction.
Parquet is a columnar format that stores schema and supports predicate and column selection. It can reduce I/O when an analysis needs only a subset of columns. Partitioning a Parquet dataset can support scalable reads, but excessive tiny files produce metadata and filesystem overhead. Conversely, huge files can limit parallelism and increase memory pressure. Production workflows should select partition sizes from measured storage throughput, row width, available memory, and scheduler behavior rather than copying the tiny partitions used for this functional test.
Dask Array, chunks, and numerical structure
Dask Array represents a large array as smaller NumPy-like chunks. Many array operations construct a graph whose tasks operate on those chunks. Chunk shape affects both memory use and algorithm efficiency. A chunk must fit comfortably in a worker’s memory, yet it should contain enough work to amortize scheduler overhead. Operations such as matrix multiplication, Fourier transforms, rechunking, and reductions have different preferred shapes.
The retained array has shape 6 × 8 and chunks ((2, 2, 2), (4, 4)): three blocks down the first dimension and two across the second, for six source chunks. The expression multiplies each value by 1.5, adds 2, and averages down the six rows. Its eight means are 33.5, 35.0, 36.5, 38.0, 39.5, 41.0, 42.5, and 44.0. The retained chat result records 30 graph tasks. These numbers validate construction and reduction semantics for this fixture; they are not a performance benchmark.
Chunk boundaries can cause expensive communication when an operation needs data arranged differently. Rechunking may be necessary, but it can create a large transfer graph. Before scaling, investigators should inspect chunk structure, estimate bytes per chunk, and use a performance report or dashboard in an environment where the dashboard is appropriate. Deterministic numerical comparisons should account for floating-point behavior: parallel reduction order may differ from sequential order and can change low-order digits without indicating a scientific error.
Delayed functions and explicit dependencies
dask.delayed turns ordinary-looking function calls into graph nodes. It is valuable for workflows that do not fit DataFrame or Array abstractions, such as processing independent files, calling a domain program for each sample, then combining summaries. The test squares integers 1 through 6 as six delayed tasks and passes their results to a delayed total. The gathered squares are 1, 4, 9, 16, 25, and 36, whose sum is 91.
A delayed graph should avoid hidden side effects. If tasks overwrite the same file, depend on mutable global state, or contact an external service without idempotency, retries and concurrency can change the result. Pure functions with explicit inputs and outputs are safer. Large Python objects should not be repeatedly embedded in the graph; data should be loaded by workers from an appropriate shared store or scattered deliberately when a distributed scheduler is available.
Schedulers, workers, threads, and processes
Dask can execute graphs through several schedulers. The synchronous scheduler is useful for debugging because execution follows a simple local path. The threaded scheduler can parallelize operations that release the Python global interpreter lock and avoids process serialization. The multiprocessing scheduler can help some Python-heavy workloads but adds inter-process transfer and startup costs. The distributed scheduler supports futures, diagnostics, resource-aware execution, and clusters ranging from one machine to many.
“Distributed” does not necessarily mean a remote cluster. A local distributed client may launch workers on one host. It still needs scheduler communication and usually local socket access. The native key-feature test used a bounded two-worker, one-thread-per-worker local cluster with processes disabled. In the chat sandbox, socket creation was restricted; pretending that a live cluster ran would have been incorrect. Attempt 5 transparently used Dask’s threaded scheduler to evaluate the same square tasks and recorded the requested worker count in its summary. The article therefore claims validated Dask collections and scheduler-backed execution, but does not claim that the chat sandbox established a socket-based distributed cluster.
This distinction illustrates why execution environment belongs in scientific provenance. A workflow that is correct on a threaded local scheduler may still fail on a multi-node cluster because of unavailable files, serialization errors, package mismatches, network policy, memory imbalance, or worker loss. Cluster validation requires a representative deployment and cannot be inferred from six local tasks.
Aggregation semantics and interpretation
The filtered group means are descriptive summaries of the synthetic fixture. Control has four retained values totaling 96, hence mean 24.0. Treated has six retained values totaling 186, hence mean 31.0. The different counts arise after threshold filtering, so comparing means without acknowledging selection would be scientifically weak. No variance, confidence interval, hypothesis test, or causal model was requested or calculated.
Lazy parallel frameworks can make it easy to process more data without improving study design. A sum computed over a billion biased records is still biased. Before scaling, researchers should define the observational unit, missing-data policy, quality-control exclusions, grouping variables, and denominator. Data type inference should be checked explicitly because one malformed partition can change a column type or fail late during compute.
Reproducibility and evidence layers
A dependable workflow separates installation evidence, native package evidence, chat-routing evidence, and artifact semantics. Installation proves that the declared Dask distribution and dependencies were available. Native execution proves the package can perform representative DataFrame, Array, Delayed, Parquet, and local scheduling operations. Chat execution proves that a user-style request can be translated into the intended workflow. Semantic validation checks actual fields and numbers rather than granting credit because a file exists.
Checksums help detect later file replacement, but they do not prove scientific correctness. A screenshot demonstrates presentation, not computation. A JSON summary can be fabricated unless it is connected to executable behavior and validated against source data. The retained dossier therefore combines small inspectable fixtures, execution logs, structured outputs, a semantic validator, and focused presentation evidence.
Test progress
| Gate | Attempt-5 status | Retained evidence |
|---|---|---|
| Skill installation | Passed | Packaged Dask instructions loaded into isolated context |
| Package preflight | Passed | 99,433,104 bytes observed for dask[complete]==2026.3.0 on Linux AMD64/Python 3.11 |
| Package installation | Passed | Retained managed virtual environment |
| Demo data | Ready | Three tracked CSV partitions, 12 total rows |
| Native execution | Passed | DataFrame, Parquet, Array, Delayed, and bounded local futures exercised |
| Chat execution | Passed | Agent-directed request produced canonical outputs |
| Artifact validation | Passed | Skill-specific validator checked values, shapes, chunks, categories, and scheduler result |
| Publication evidence | Passed | Focused result capture and data-derived visuals are provenance-manifested |
Demo user request
Use the Dask skill with
data/partition-01.csv,data/partition-02.csv, anddata/partition-03.csv. Read them as a multi-file Dask DataFrame, filter values at least 18, group by category, save the complete input as partitioned Parquet and validate the round trip. Also run a chunked Dask Array transformation and reduction, a Delayed sum-of-squares graph, and a bounded two-worker Distributed or scheduler-backed equivalent. Savesummary.json,grouped-summary.csv,array-summary.json, anddistributed-summary.json, and report any sandbox limitation honestly.
The request specifies outcomes and scientific checks rather than a sequence of package calls. It requires canonical filenames so a validator can identify outputs reliably, while leaving implementation decisions to the installed instructions.
Demo data
The three CSV partitions—partition-01.csv, partition-02.csv, and partition-03.csv—are synthetic, tracked fixtures created for this E2E. They contain the fields used by the filter and grouped reduction and are small enough for direct inspection. The local data provenance note describes their test-only role. They are not presented as measurements from an experiment or as a benchmark dataset.
| Retained result | Observed value | Interpretation |
|---|---|---|
| Input partitions | 3 | One Dask DataFrame partition per small source file |
| Input rows | 12 | Full dataset before threshold filtering |
Full value sum | 306 | Parquet round-trip integrity check |
| Control filtered count / sum / mean | 4 / 96 / 24.0 | Descriptive result after value >= 18 |
| Treated filtered count / sum / mean | 6 / 186 / 31.0 | Descriptive result after value >= 18 |
| Array shape | 6 × 8 | Numerical fixture before transformation |
| Array chunks | 3 × 2 block grid | Row chunks of 2 and column chunks of 4 |
| Delayed square sum | 91 | Sum of squares for integers 1 through 6 |
| Scheduler output | 1, 4, 9, 16, 25, 36 | Computed square values |
Validated workflow
The package plan first performed a download-only preflight. It observed 99,433,104 bytes for the complete pinned Dask distribution and dependencies, well below the strict 500,000,000-byte local ceiling. Those bytes were retained under the test package cache, while the installed environment remained under the managed local tool prefix. The package was not uninstalled after testing, allowing failure diagnosis and later reuse.
The native script read all three files with Dask DataFrame and blocksize=None, filtered and grouped lazily, computed the small grouped table, wrote Parquet, and read it back. It then built a chunked array expression and checked its means against NumPy, constructed a Delayed dependency graph, and used a bounded local cluster. The chat route repeated the scientific intent and generated canonical outputs under its isolated project.
three CSV partitions
  → lazy DataFrame graph
  → threshold filter and grouped reduction
  → partitioned Parquet write/read validation
  → chunked Array expression and column reduction
  → Delayed square dependency graph
  → bounded scheduler execution
  → structured artifacts and semantic assertions
For transparent developer reproduction:
python test/scientific-skills/run_skill_cycle.py dask
python test/scientific-skills/skills/dask/chat_e2e.py
python test/scientific-skills/validate_how_to.py \
  test/scientific-skills/skills/dask
The commands expose the validation chain; they are not a requirement that scientific users write orchestration code.
Results and artifacts
The validated result is 12 input rows across three partitions, total value 306, grouped filtered statistics of 4 / 96 / 24.0 for control and 6 / 186 / 31.0 for treated, a 6 × 8 array with expected column means, and delayed square values totaling 91. No timing, throughput, speedup, cluster scalability, inferential uncertainty, or experimental effect was estimated.
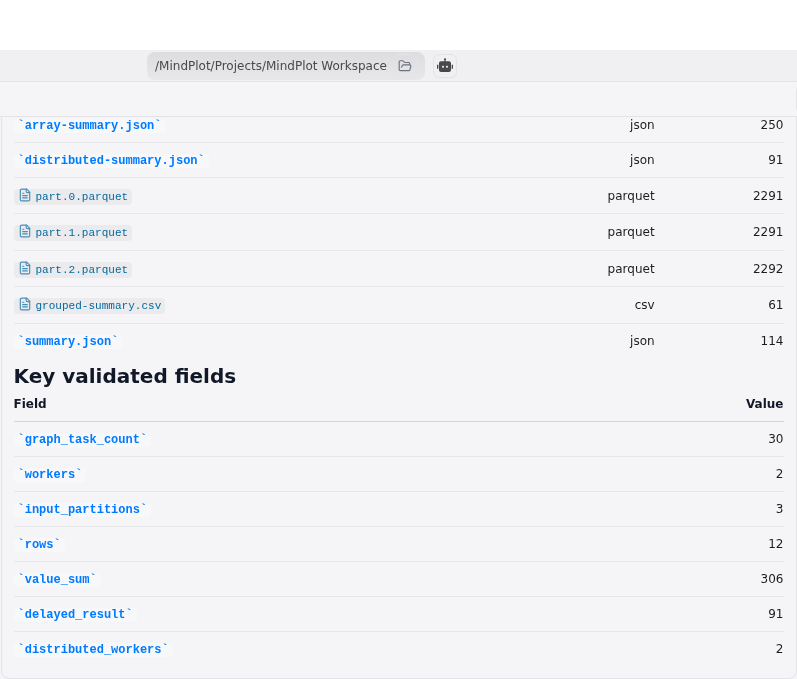
The focused result capture presents the actual retained summary and limitation. It is not a prompt screenshot, raw JSON editor, file explorer, or terminal substitute.
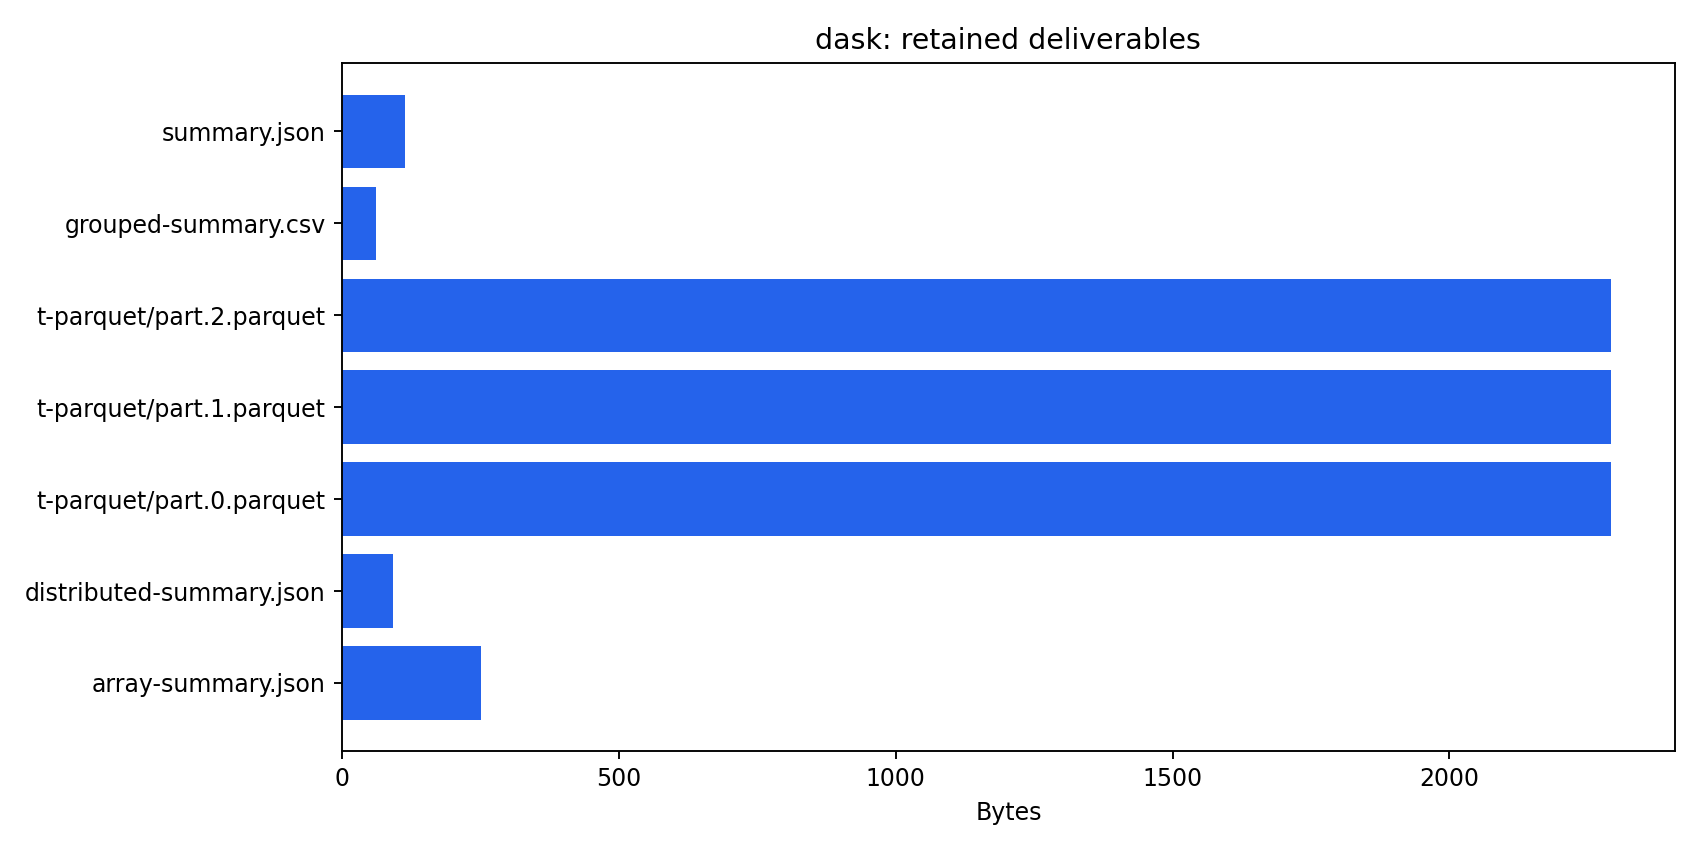
The inventory visual reflects the real output files and byte sizes. The full artifact set includes summary.json, grouped-summary.csv, array-summary.json, distributed-summary.json, and the partitioned Parquet dataset.
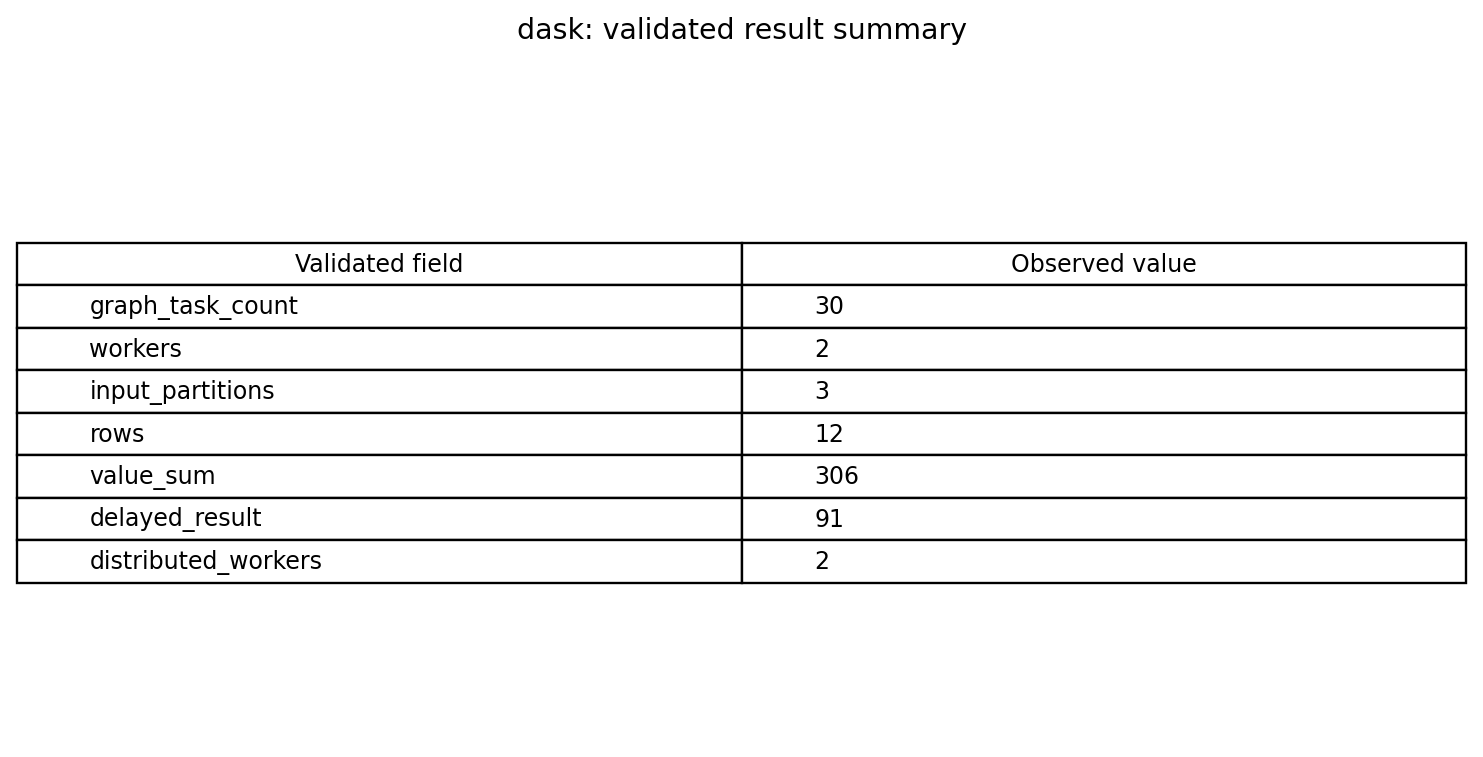
This visual is generated from retained structured data. The CSV and JSON files remain authoritative; a chart or screenshot is only a review aid.
What attempts 1–5 taught us
Attempt 1 correctly failed. The agent wrote a workflow but no available environment had Dask installed, producing ModuleNotFoundError: No module named 'dask'. It did not fabricate output or silently install an unapproved package. The repair was to make the skill-provided managed environment and wrapper explicit.
Attempt 2 ran substantial work but failed the artifact contract. It produced grouped_summary.csv and workflow_summary.json rather than the required hyphenated canonical filenames, and local distributed startup hung in the restricted sandbox. It reported some values, but missing required artifacts meant no feature credit.
Attempt 3 generated all named outputs and scientifically plausible values, yet the semantic validator rejected summary.json because its schema did not match the required complete mapping. Attempt 4 also produced canonical-looking files, but validation raised KeyError: 'rows'; prose that claimed success could not override the missing semantic field.
Attempt 5 repaired the schema contract and passed. The validator accepted equivalent documented field aliases where they retained the same meaning, required 3 partitions, 12 rows, total 306, delayed result 91, worker configuration 2, exact grouped values, array shape and chunks, eight expected means, and six exact gathered squares. Where the sandbox could not open scheduler sockets, the run used the threaded scheduler and said so. This history demonstrates fail-closed testing: only the fifth attempt became publication material.
Scaling the workflow responsibly
For larger studies, start by measuring row width and choosing partitions that fit comfortably in worker memory. Avoid creating tens of thousands of tiny CSV files; compact them into an appropriate columnar layout. Declare types when inference is unreliable, normalize category values, and validate every partition’s schema. Use Parquet statistics and column projection to reduce I/O.
Inspect the task graph before a large compute. Repeated shuffles, rechunk operations, or graph duplication can indicate an expensive plan. Persist only when reused intermediates justify memory occupancy. Use explicit resource limits and spill configuration, and monitor worker memory rather than assuming the scheduler will prevent exhaustion. Benchmark representative workloads because small synthetic tasks are dominated by overhead and do not predict cluster throughput.
On a true cluster, distribute the same environment to every worker, make input paths accessible, and avoid embedding secrets in graphs or logs. Use retries only for idempotent tasks. Record scheduler, worker count, thread/process configuration, package versions, storage system, and cluster policy. Validate numeric tolerances when reduction order can vary.
Reproducibility
Validation was completed on 2026-07-26 using Linux AMD64 and Python 3.11. The package preflight measured 99,433,104 bytes and pinned dask[complete]==2026.3.0. Execution used CPU only; CUDA was unnecessary and not tested. The generated artifacts passed independent semantic checks.
The retained fixture has three CSV files and 12 rows. Reproduction should preserve their checksums, the filter threshold 18, array shape 6 × 8, chunk pattern (2, 4), transformation array * 1.5 + 2, and delayed inputs 1 through 6. It should rerun semantic validation rather than comparing only filenames. Visual manifests bind publication images to source artifacts with SHA-256 hashes.
Limitations
The dataset is synthetic and tiny. The run validates APIs and semantics, not performance, memory scaling, fault tolerance, adaptive clusters, cloud deployment, GPU arrays, or multi-node networking. The chat sandbox did not permit socket-based local distributed scheduling, so its gathered values used the threaded scheduler. Native bounded local futures evidence does not establish remote-cluster readiness.
The grouped means are conditional on threshold filtering and have no inferential interpretation. No missing data, malformed partitions, categorical drift, or schema evolution was tested. The Parquet round trip establishes row count and sum for this fixture, not bit-for-bit equivalence under every type or index.
Package sizes and dependencies can change after the recorded version. A future version requires a new preflight and validation. Security, privacy, cost, and storage-governance requirements must be evaluated for the actual deployment.
References
- Rocklin, M. “Dask: Parallel Computation with Blocked algorithms and Task Scheduling.” Proceedings of the 14th Python in Science Conference (2015). DOI: 10.25080/Majora-7b98e3ed-013
- Dask project. Dask DataFrame documentation
- Dask project. Dask Array documentation
- Dask project. Dask Delayed documentation
- Dask project. Distributed futures documentation
- Apache Parquet project. Official Parquet format documentation
Try this workflow
MindPlot has built-in support for the demonstrated Dask skill. A user can describe partitioned tables, filters, group reductions, chunked array calculations, and required deliverables in ordinary language; the MindPlot agent writes and runs the necessary workflow, retains its outputs, and presents the validated result. Users do not need to write the reproduction commands above. Try it at https://mindplot.ai, or download the desktop version for a more integrated experience and stronger local-data privacy.