
Table of contents
- Scientific introduction
- Primary validated result
- Test progress
- Prerequisites and validated installation
- Demo user request
- Demo data
- Workflow followed by the installed skill
- Choosing worker counts safely
- Memory and large-data strategies
- Results and artifacts
- Failures, repairs, and alternative paths
- Reproducibility
- Limitations
- Try this workflow
- References
A reliable scientific computation begins by measuring the machine that will run it. In the validated example documented here, a native resource detector identified 8 physical CPU cores, 16 logical CPU cores, 31.06 GiB of RAM, 16.06 GiB of currently available RAM, 103.12 GiB of available project-disk space, and no usable GPU accelerator. The detector suggested an upper CPU-worker count of 14, while the operational interpretation recommended starting memory-heavy work at 8–12 workers and scaling only after observing memory and I/O pressure. These values are a timestamped host snapshot, not a benchmark or a permanent hardware specification.
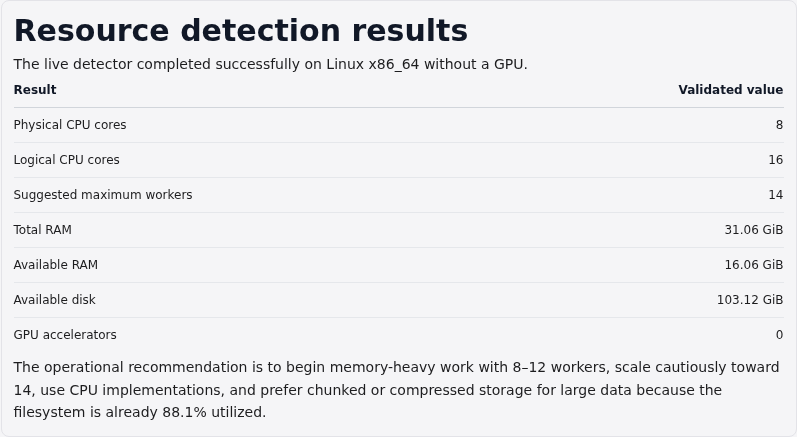
This article explains why resource discovery is a scientific reproducibility step rather than an administrative convenience. It covers CPU topology, available versus total memory, accelerator detection, disk headroom, parallel-worker selection, chunked data strategies, the exact validated workflow, and the limits of conclusions drawn from a single live snapshot. The result was produced by executing the skill-supplied native detector, not by asking a language model to estimate hardware from prose.
Scientific introduction
Computational results depend on more than source code and input data. Available memory changes whether an analysis can materialize a matrix in RAM; CPU topology influences safe parallelism; filesystem pressure can interrupt a simulation or corrupt an incomplete export; and accelerator availability determines whether a CUDA-, ROCm-, or Metal-specific method can run at all. Recording these conditions makes a workflow easier to reproduce and helps distinguish a scientific failure from an environmental failure. A job killed by the operating system because every worker copied a large array is not evidence that the underlying method is invalid.
The word “CPU count” is deceptively simple. A physical core represents a hardware execution core, whereas a logical core may be a simultaneous multithreading context. Sixteen logical cores therefore do not guarantee twice the throughput of eight physical cores. Workloads compete for caches, memory bandwidth, storage bandwidth, and library-level thread pools. NumPy, BLAS, OpenMP, and domain packages may create internal threads while an outer process pool creates workers, producing oversubscription. A conservative worker count leaves capacity for the operating system and avoids multiplying hidden thread pools. Python’s official multiprocessing documentation describes process-based data parallelism and also notes that objects sent through multiprocessing queues are serialized, which adds memory and communication cost.
Memory must also be interpreted carefully. Total RAM describes installed or visible capacity; available memory estimates what can be allocated without immediate swapping, after accounting for reclaimable caches. “Available” is more useful than “free” for an operational decision, but it still changes from moment to moment. Multiple processes may each hold a copy of the same data, temporary arrays can briefly exceed the steady-state footprint, and memory-mapped files can shift pressure between RAM and disk. A 10 GiB table is not automatically safe merely because 16 GiB was available at detection time. The analysis must reserve headroom for the interpreter, libraries, intermediate arrays, the desktop, and other processes.
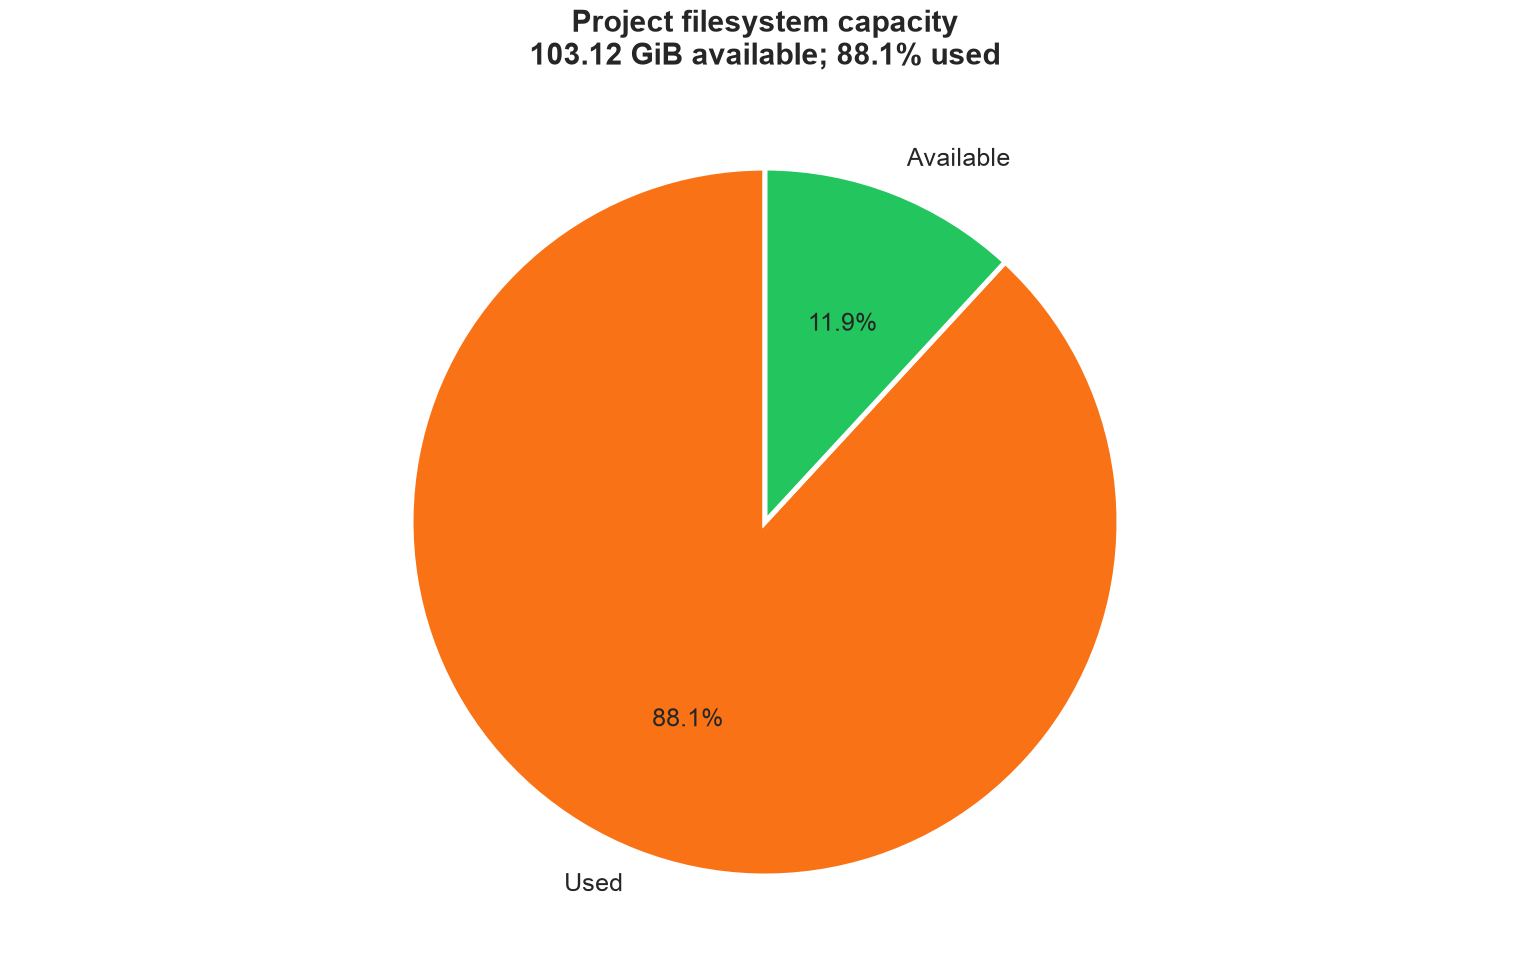
Disk capacity is likewise more than a single free-space number. The validated filesystem had 103.12 GiB available, but it was already 88.1% used. That combination permits moderate outputs while warning against unbounded intermediates or duplicate dataset copies. Filesystems can perform poorly near capacity, quotas may differ from partition totals, and temporary files may be written to another mount. A robust plan identifies the actual working directory, writes outputs atomically where possible, and keeps a safety buffer. For tabular and array data, chunked or columnar formats can reduce peak storage and permit partial reads.
Accelerator discovery must fail closed. The absence of NVIDIA, AMD, or Apple accelerator records means only that no supported accelerator was visible to the detector in this environment. It does not prove that the computer has no physically installed device, because drivers, containers, permissions, or scheduler allocation may hide one. Conversely, seeing a device does not prove that a particular package, driver, toolkit, or model is compatible. CUDA validation needs a real CUDA execution test; it cannot be inferred from a GPU name. The validated result therefore recommends CPU implementations and makes no CUDA claim.
The detector uses psutil for cross-platform CPU, memory, and disk information and platform-specific probes for accelerators. The official psutil API documents cpu_count, virtual_memory, and disk_usage, including disk totals, used space, free space, and percentage utilization. Such APIs provide observations, not workload benchmarks. Before a long run, a short calibration with representative data remains valuable: measure wall time, peak resident memory, temporary storage, and scaling at several worker counts.
Primary validated result
| Resource or decision | Observed value | Interpretation |
|---|---|---|
| Operating system | Linux 6.8.0-124-generic, x86_64 | Linux CPU/amd64 validation only |
| Physical CPU cores | 8 | Hardware-core baseline |
| Logical CPU cores | 16 | Upper concurrency signal, not guaranteed speedup |
| Detector worker suggestion | 14 | Upper suggestion with two logical contexts left free |
| Total RAM | 31.06 GiB | Visible physical-memory capacity |
| Available RAM | 16.06 GiB | Timestamped allocation headroom |
| Swap available | 11.47 GiB | Emergency capacity, not performance RAM |
| Project disk available | 103.12 GiB | Usable snapshot on the working filesystem |
| Project disk utilization | 88.1% | High enough to justify cleanup and bounded intermediates |
| Detected GPUs | 0 | Use CPU paths; no CUDA, ROCm, or Metal validation |
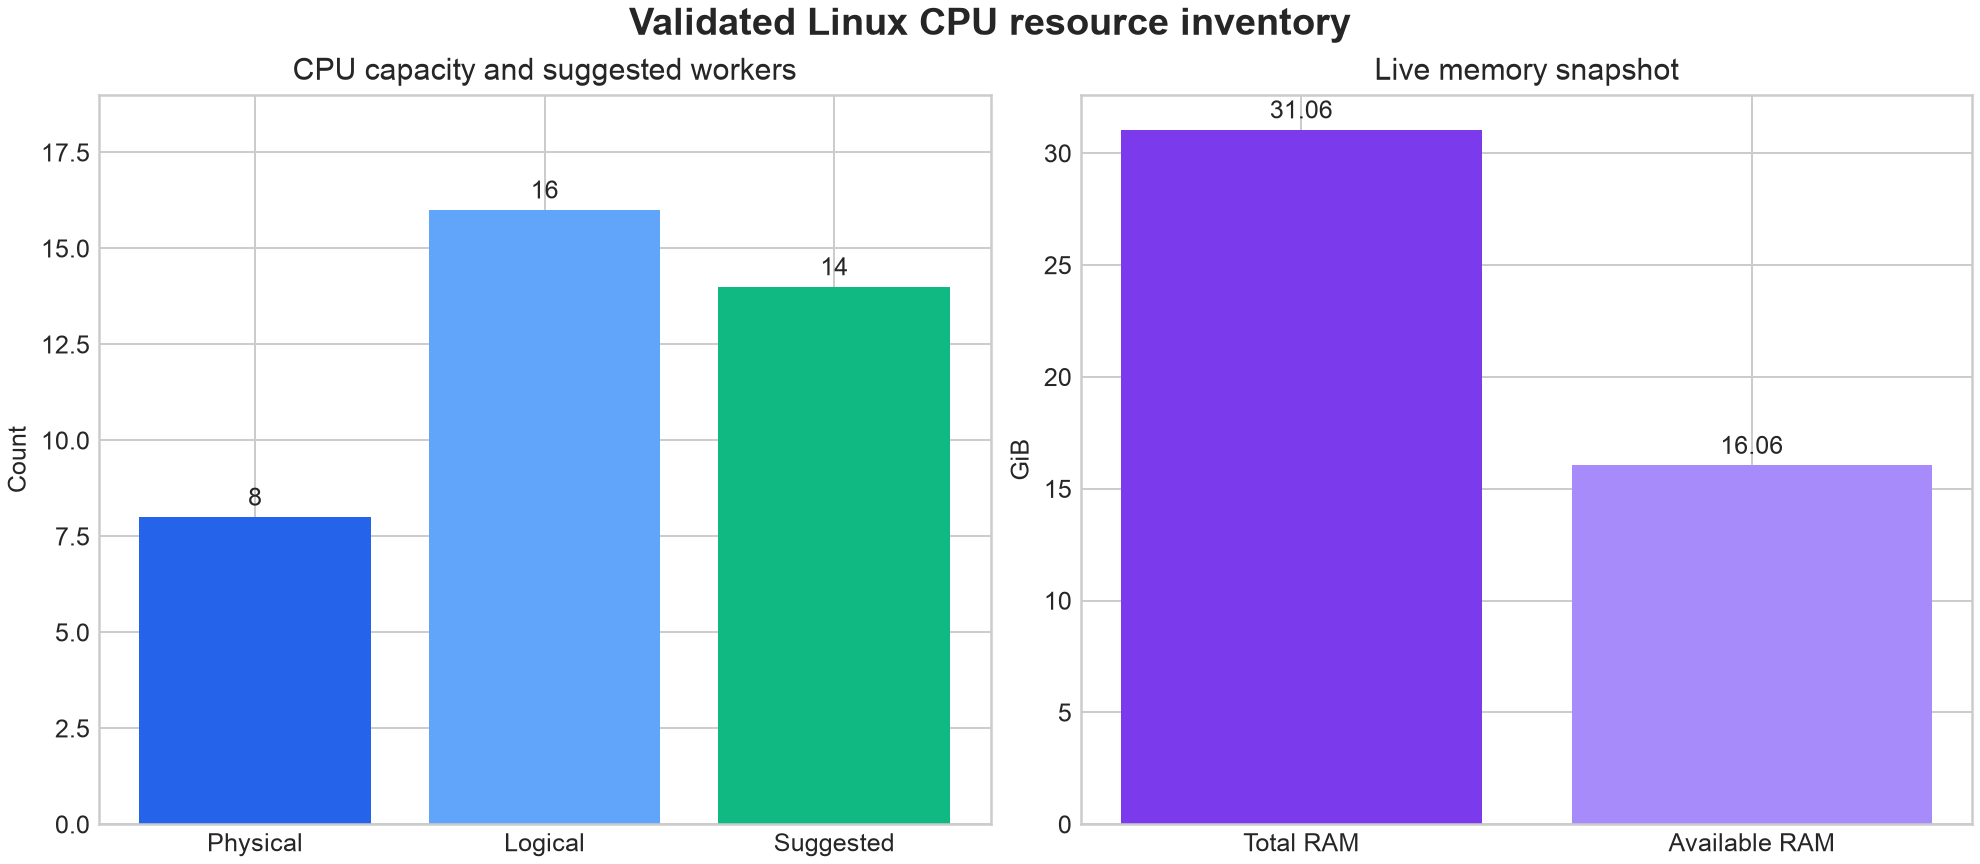
The most useful conclusion is not “use 14 workers everywhere.” It is “14 is a detector-proposed ceiling for suitable CPU work, while 8–12 is a safer starting interval for tasks with substantial memory or I/O.” For pure Python CPU work, processes may help bypass interpreter constraints, but serialization and replicated data can dominate. For compiled numerical kernels, threads may already be used internally. For small tasks, parallel startup overhead can make a single worker faster.
Test progress
| Gate | Status | Retained evidence |
|---|---|---|
| Skill Hub installation | Passed | Installed source retained in attempt-12 |
| Package installation | Passed | No separate package required beyond the managed environment and psutil |
| Platform/runtime | Passed | Linux CPU/amd64 agent-directed execution |
| Native feature execution | Passed | Native detector generated the complete schema |
| Chat execution | Passed | Natural-language request completed through the active backend |
| Artifact validation | Passed | JSON structure, numerical invariants, accelerator count, and recommendation groups validated |
| Article readiness | Publishable evidence available | Bilingual editorial and visual checks still apply |
Earlier attempts are important to the developer audit trail. The initial harness bypassed the application’s selected execution path and tried an unrelated legacy API-provider route. That was a harness defect, not a scientific-skill failure. After restoring the application-selected route, the first successful chat generated reasonable but differently named artifacts; the contract was repaired to specify two user-facing files. A subsequent semantic check detected a hand-reconstructed GPU schema that omitted apple_silicon. The skill projection was then fixed to expose the canonical source directory and instruct the agent to execute the native script rather than reconstruct it. The final rerun passed all gates.
Prerequisites and validated installation
The validated host was Linux x86_64 with Python 3.8.16 used by the native detector. The skill requires psutil; it does not download a model, compile a native research package, or require a GPU. The Skill Hub installation places the workflow in agent context, while the application’s managed Python environment supplies the runtime dependency. The exact package transfer remains comfortably below the 500 MB lightweight-host limit because there is no separate scientific distribution for this skill.
For transparent reproduction, the core command is equivalent to:
python scripts/detect_resources.py \
  --output outputs/resource_inventory.json \
  --verbose
The chat workflow additionally writes outputs/resource_recommendations.md. That Markdown file interprets the native values without replacing or silently altering the JSON source. Anyone auditing the result should compare statements in the recommendation file with the timestamped inventory.
Demo user request
Detect the CPU, memory, disk, operating system, and accelerator resources available for this project. Save the full JSON inventory and recommend safe parallelism, memory handling, GPU usage, and large-data strategies.
This request is intentionally phrased as a user goal. It does not prescribe internal Python code or hard-code expected hardware values. The workflow must discover the current host, save the evidence, interpret it conservatively, and report the deliverable paths.
Demo data
There is no downloaded scientific dataset because the host itself is the measured system. The input consists of live operating-system observations made at execution time. This has several consequences: the data cannot be redistributed as a universal benchmark, reruns will differ as memory and disk usage change, and a result from one machine must not be copied into another machine’s plan.
The JSON schema contains timestamp, os, cpu, memory, disk, gpu, and recommendations. Memory and disk capacities are recorded in GiB-like binary conversions even though the field suffix is _gb; readers should treat the values as operational rounded capacities rather than metrological measurements. CPU frequencies are in MHz. GPU arrays record detected NVIDIA and AMD devices, while apple_silicon records an Apple accelerator when applicable. total_gpus must equal the sum of these detected categories.
Workflow followed by the installed skill
First, the agent loaded the installed workflow and resolved its relative script path against the canonical installed source directory. Second, it executed the supplied detector in the active project rather than writing a substitute inventory generator. Third, the detector queried OS metadata, physical and logical core counts, CPU frequency, virtual memory, swap, filesystem usage, and supported accelerator tools. Fourth, it generated recommendations for parallel processing, memory strategy, accelerator use, and large-data handling. Finally, the agent wrote a readable interpretation and reported both artifact paths.
Semantic validation checked that the OS and machine fields were non-empty; logical cores were positive; total and available capacities were non-negative and coherent; accelerator totals matched the detailed device lists; and all four recommendation groups existed. The Markdown interpretation was also required to discuss parallelism, memory, GPU use, and large-data handling. This prevents a syntactically valid but scientifically incomplete JSON file from passing.
Choosing worker counts safely
Start with workload structure. Independent records with small inputs and outputs are good candidates for process parallelism. Large shared arrays may be better served by threads inside compiled kernels, shared memory, memory mapping, or chunked task scheduling. Benchmark one, four, eight, and perhaps twelve workers on a representative subset. Record elapsed time, peak memory, CPU utilization, and storage traffic. Stop increasing workers when throughput flattens or memory and I/O costs rise.
The detector’s 14-worker suggestion leaves two logical contexts unassigned, but it cannot see an algorithm’s per-worker memory footprint. If each worker needs 2 GiB, fourteen workers could exceed the 16.06 GiB available snapshot before accounting for the parent process. A bounded plan might use six workers for such a task. If each worker streams a small record and spends time waiting for independent network or disk operations, a higher count might be reasonable. Resource discovery narrows the search; measurement selects the final configuration.
Avoid nested parallelism. When a process pool calls BLAS code that launches sixteen threads per process, eight workers can attempt 128 computational threads. Set library thread limits or choose one level of parallelism. Preserve these settings in the analysis log because performance and numerical reduction order can change with concurrency.
Memory and large-data strategies
When a dataset approaches available RAM, use chunking before failure occurs. Dask’s official best-practices documentation warns against very large partitions and recommends choosing partition or chunk sizes appropriate for the workload. A useful chunk must fit comfortably in memory together with intermediate arrays and concurrent tasks. Parquet supports column and row-group selection for tables; Zarr stores chunked, compressed N-dimensional arrays and supports concurrent access patterns. HDF5 can serve similar local-array workflows when its access and concurrency constraints are understood.
Chunking is not automatically faster. Too-small chunks create scheduler and metadata overhead, while too-large chunks recreate peak-memory problems. Compression saves disk and I/O at the cost of CPU. The correct balance depends on data type, access pattern, compression ratio, filesystem, and downstream operations. Record chunk shape, compressor, partition size, and schema alongside results.
The filesystem chart shows why free capacity and utilization belong together. More than 100 GiB remained, yet only about 11.3% of the filesystem was free. A workflow producing a 60 GiB intermediate plus checkpoints and a final copy could exhaust it. Prefer streaming transformations, remove safely reproducible temporaries, and estimate expansion ratios before decompressing archives.
Results and artifacts
The complete native inventory is available as resource_inventory.json. The interpreted operating guidance is resource_recommendations.md. Both belong to attempt-12 and were checked by the same semantic validator that determined the test status.
The result establishes that the demonstrated host can run CPU workflows and moderate in-memory analyses, subject to workload-specific calibration. It does not establish that fourteen workers are optimal, that 16 GiB will remain available later, that the disk can safely accept 103 GiB of new data, or that a hidden accelerator is impossible. It specifically does not validate CUDA. Those distinctions keep the output useful without converting a live inventory into an unsupported performance claim.
Failures, repairs, and alternative paths
Three repairs materially improved the delivered workflow. Execution selection now follows the application’s configured route instead of choosing an unrelated API provider. Installed Skill Hub workflows are projected into agent sessions. Projected workflows identify their source directory so adjacent scripts and references remain executable. Finally, the skill now states that user-facing chat runs must preserve both the native JSON and a separate Markdown interpretation.
If psutil is unavailable, install it into the owned managed environment rather than the system Python. If an accelerator probe command is missing, report the accelerator as unvalidated instead of guessing. On Windows or macOS, rerun the complete semantic test because process creation, disk paths, memory accounting, and accelerator backends differ. In a container or scheduler job, interpret the visible allocation rather than the physical host.
Reproducibility
Validation date: 2026-07-26. Platform: Linux x86_64, kernel 6.8.0-124-generic. Python reported by the detector: 3.8.16. Accelerator: none detected. The retained developer report records successful skill installation, agent-directed execution, artifact existence, and semantic-validator exit code zero.
The inventory is intentionally timestamped. Reproduce it by installing the same workflow, submitting the same natural-language request, and comparing schema invariants rather than expecting identical available-memory or disk values. Preserve package versions, operating-system changes, container limits, scheduler allocation, and worker/thread settings with any downstream analysis.
Limitations
This test validates one Linux CPU/amd64 environment. It does not validate Windows, macOS, ARM, CUDA, ROCm, Metal, container-device passthrough, cluster schedulers, NUMA topology, network filesystems, quotas, CPU thermal behavior, or sustained performance. CPU frequency is a live reading and can change with power management. Disk totals describe the partition containing the project path, not every storage device. Swap capacity should not be treated as equivalent to RAM.
The detector offers strategy labels based on broad thresholds. These labels are starting points, not scientific optimization results. A production workflow should add representative calibration, peak-memory instrumentation, failure recovery, and storage estimates. Security-sensitive environments should also review whether system inventory files may reveal host details before sharing them.
Try this workflow
MindPlot has built-in support for this resource-detection skill. You can try it at mindplot.ai or download the desktop version for a better integrated experience and stronger local-data privacy. Users do not need to write or run the reproduction code shown above: the MindPlot agent reads the installed skill, writes and runs the appropriate script, validates the outputs, and presents the resulting files.
References
- psutil official API reference: CPU, virtual memory, and disk usage.
- Python documentation: process-based parallelism with multiprocessing.
- Dask official documentation: best practices and partition sizing.
- Open Geospatial Consortium: Zarr Storage Specification.
- Zarr project documentation: chunked, compressed N-dimensional arrays.