
 MindPlot
Dein eigener KI-Co-Wissenschaftler
Von Rohdaten zu publikationsreifen Einblicken. Von Datenaufbereitung, Modellierung und statistischer Analyse bis hin zu professionellen Visualisierungen und Berichten — Ihr umfassendes AI-Toolset.

MindPlot Offer
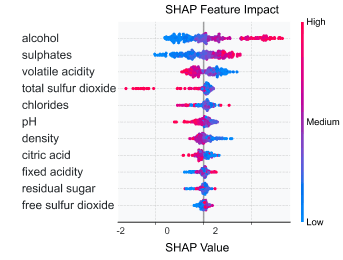
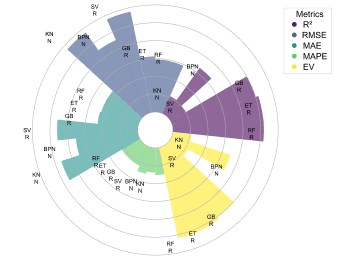
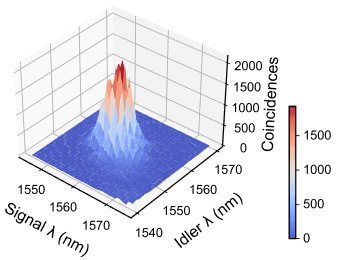
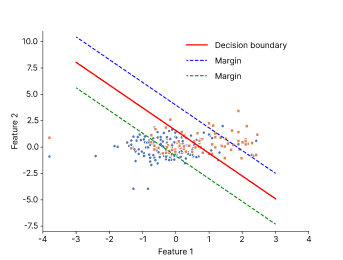
Schöne, publikationsfertige wissenschaftliche Plots
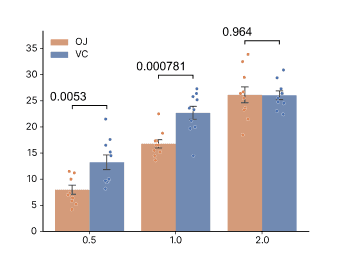
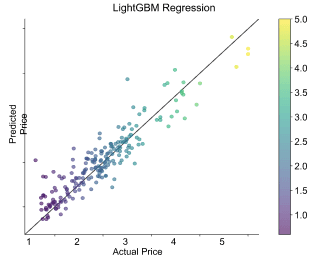
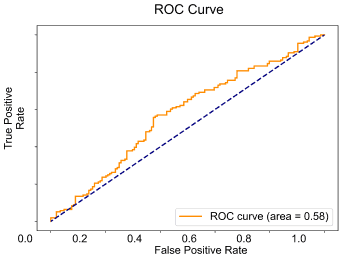
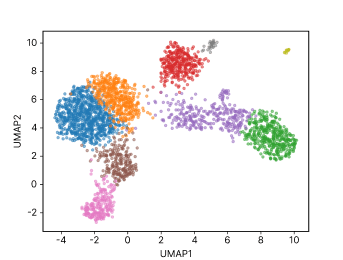
MindPlot Features
Sprich mit deinen Daten
Dialogorientierte AI für natürliche Befehle. Keine Programmierung nötig.
Automatische Datenbereinigung
Fehlende Werte und Ausreißer sofort beheben
Spontan anpassen
Schriftarten, Farben und Skalen sofort ändern
AI Power
Intelligenter. Die AI versteht Sie.
Beliebiges einspeisen
Bilder, Excel, CSV
Flexibler Export
Bitmap (png,jpg), Vektor (svg,pdf)
Vollständige statistische Berichte
Automatisch generiertes Word/PDF mit Methoden & Ergebnissen
Code-Export
Python-Code herunterladen, um Analysen zu überprüfen
MindPlot research blog
Ideas, methods, and evidence.
如何用 Aeon 分析时间序列:DTW 分类、聚类与相似度计算
Aeon 提供了一套面向时间序列的 Python 工具,可以在保留观测顺序的前提下比较曲线、识别类别并探索分组。下面的例子从六条容易核对的短曲线出发:DTW 最近邻模型判断两条未参与训练的曲线是上升还是下降,时间序列 k 均值恢复两个趋势组,距离计算则解释相似曲线与相反曲线为何会被区别对待。两条留出曲线都得到正确分类;两条相似上升曲线的 DTW 距离是 0.06,上升曲线与下降曲线之间的距离是 70.0。这些结果适合验证分析流程是否真正工作,但六条刻意简化的曲线不能代表模型在真实传感器、临床或实验数据上的准确率。
Read article →02如何用 Dask DataFrame、Array、Delayed 与 Distributed 分析分区科学数据
可复现的 Dask 工作流能够惰性读取分区测量数据,执行筛选和分组汇总,写出分区 Parquet 数据集,变换分块数值数组,并求值具有明确依赖关系的任务图,而不必把所有中间数据同时塞入内存。经过验证的演示中,三个 CSV 分区共包含 12 行,value 总和为 306。按 value = 18 筛选后,control 的计数、和、均值分别为 4、96、24.0;treated 分别为 6、186、31.0。另一个 6 × 8 分块数组得到从 33.5 到 44.0 的八个列均值;六个延迟平方任务之和为 91。Dask 2026.3.0 在保留的第 5 次尝试中完成这些功能。由于聊天沙箱不允许
Read article →03如何使用 Python、psutil 与可复现系统清单检测科学计算资源
开展科学计算之前,最重要但经常被忽略的一步,是先测量真正执行任务的机器,而不是根据设备型号、云主机名称或经验猜测可用资源。本次经过完整验证的实例检测到:Linux x8664 主机拥有 8 个物理 CPU 核心、16 个逻辑核心、31.06 GiB 总内存、16.06 GiB 当前可用内存、103.12 GiB 项目文件系统可用空间,并且没有检测到可用 GPU 加速器。原生检测器给出的并行上限建议为 14 个工作进程;结合内存和 I/O 风险,更稳妥的操作建议是从 8–12 个工作进程开始,再依据真实负载逐步扩展。
Read article →04如何用可复现的 Hugging Face 目录检索寻找生物学机器学习模型
直接答案:本次经过验证的在线目录检索找到九十五条生物学相关模型记录,生成四万一千九百一十二字节的 JSON 快照和二千五百八十七字节的 Markdown 推荐报告;测试没有下载、运行、基准评测或背书任何模型。
Read article →05如何使用 GNU Octave 求解并审计 MATLAB 兼容的线性代数流程
GNU Octave 将线性方程组求解为 x=[2,3],并独立核验该预期向量。5个信号观测的均值为6,样本标准差为6.59545297913646。流程保留了MATLAB兼容的MAT工作区以及栅格和矢量图。。该结果在保留的第11次尝试中通过原生执行、真实聊天端到端执行和语义产物验证,只能在本演示的数据、方法和限制范围内解释。
Read article →06如何使用 Matplotlib 创建可发表的多面板科学图
流程读取6条测量记录,使用Matplotlib面向对象接口创建两个坐标轴,并绘制折线、误差棒、散点、注释与图例。输出为1823×1223像素、200 dpi的PNG,以及保留可编辑文字的SVG。。该结果在保留的第9次尝试中通过原生执行、真实聊天端到端执行和语义产物验证,只能在本演示的数据、方法和限制范围内解释。
Read article →07如何使用 PennyLane 自动微分计算量子线路梯度
直接结论。 在 θ = 0.432 弧度时,线路1上的 Pauli-Z 期望值为0.908130190694961。PennyLane 自动梯度为−0.4186878989752795,解析值−sin(θ)为−0.41868789897527947,绝对误差仅5.55 × 10⁻17。。该结果在保留的第5次尝试中通过原生执行、真实聊天端到端执行和语义产物验证,只能在本演示的数据、方法和限制范围内解释。
Read article →08如何使用 Qiskit 构建、转译并验证贝尔态实验
科学原理导论 贝尔态实验是能够展示双量子比特非经典关联的最小工作流之一。电路从计算基态 |00〉 出发,先在第一个量子比特上施加 Hadamard 门,再以第一个量子比特为控制端、第二个量子比特为目标端施加受控 X 门。在理想电路模型中,这两步得到 (|00〉 + |11〉)/√2。测量不会返回“半个状态”,每次 shots 只产生普通比特串;重复测量后,00 与 11 应各占大约一半,而无噪声态矢量模拟中的 01 和 10 应保持零计数。
Read article →09如何使用 QuTiP 模拟阻尼谐振子并验证光子数衰减
科学原理导论 开放量子系统会与环境交换能量或信息,因此一般不能只用封闭系统的薛定谔方程描述。常见的 Markov 近似采用 Lindblad 主方程,让密度算符在 Hamiltonian 和耗散 collapse terms 共同作用下演化。对于零温阻尼谐振子,与湮灭算符成比例的 collapse operator 会持续移除激发;如果初始状态是含五个光子的 Fock 态,并且衰减常数约定一致,平均光子数应遵循 n(t)=n0 exp(-κt)。
Read article →10如何使用 Psi4 计算电子反应能并比较基组影响
科学原理导论 反应能把分子电子结构与化学变化联系起来。在最基础的量子化学层面,电子反应能是产物与反应物电子能量按照化学计量数加权后的差。公式虽然很短,可信计算却必须同时满足多项条件:反应式元素守恒,每个分子的电荷和多重度正确,坐标来源明确,所有物种采用一致的电子结构方法,自洽场确实收敛,单位转换透明,并且报告准确说明该数值代表什么、不代表什么。
Read article →11如何使用 GFN2-xTB 计算垂直电离势与电子亲和能
科学原理导论 氧化和还原涉及移除或加入电子,但任何计算得到的“氧化还原数值”只有在电子状态定义与热力学范围明确时才有意义。电离势描述移除电子的能量代价,电子亲和能描述加入电子的能量变化。垂直量在中性分子的几何构型上评估带电状态,而绝热量允许离子结构弛豫。气相能量差也不同于溶液中相对于参比电极的电势。
Read article →12如何制定经过证据审计的 NSF 科研基金申请规划包
直接结论。 运行生成了7份规划产物。审计将三年项目周期、直接成本总额和目标数量与输入逐项核对,明确标记 submissionready 为 false,并将无依据主张扫描结果记为 passwithflags,保留需要项目负责人和机构复核的问题。。该结果在保留的第3次尝试中通过原生执行、真实聊天端到端执行和语义产物验证,只能在本演示的数据、方法和限制范围内解释。
Read article →13如何为小麦微塑料与干旱研究构建可证伪科学假设
直接结论。 验证档案保留12周周期、4个生长室和12,000美元预算上限,生成7项机制不同且明确标注为探索性的假设、4项跨学科联系和6项受挑战假设,并依据考虑生长室效应的决策规则优先选择3项思路。该结果在保留的第3次尝试中通过原生执行、真实聊天端到端执行和语义产物验证,只能在本演示的数据、方法和限制范围内解释。
Read article →14如何批判性评价存在失访与结局转换的预防性随机试验
直接结论。 在纳入分析者中,Supplement X 组感染风险为12/42即28.57%,对照组为18/56即32.14%,绝对风险差为−3.57个百分点;由于差异性失访、分配隐藏不清、参与者和评价者未盲以及数据收集后更换注册主要结局,验证评价将证据确定性评为极低,不能确立预防效果。该结果在保留的第5次尝试中通过原生执行、真实聊天端到端执行和语义产物验证,只能在本演示的数据、方法和限制范围内解释。
Read article →15如何用 Matplotlib 和 Seaborn 制作可发表的剂量—反应科学图
这套经过验证的双面板剂量—反应工作流,从四个剂量水平生成了 300 DPI 的 PNG 和可编辑 SVG。在 4 µM 终点,control 为 90%,treated 为 43%,两者相差 47 个百分点。最终图使用 Matplotlib 3.10.5、Seaborn 0.13.2、明确指定的 DejaVu Sans 字体栈、对色觉缺陷较友好的蓝色与橙红色组合、误差棒、面板标签以及无边框图例。保留的第 8 次尝试在 Linux x8664 CPU 环境中通过了软件包安装、原生绘图、自然语言聊天执行和产物语义验证。这个结果证明所演示的可复现绘图流程能够工作,但不能据此宣称处理有效,也不能代替统
Read article →16如何使用 SHAP、TreeExplainer、蜂群图、依赖图与瀑布图解释随机森林预测
科学原理导论 预测模型可能具有不错的精度,却仍然难以审查。随机森林把许多决策树的结果取平均,每棵树又包含不同变量、阈值与交互关系,因此阅读一棵树不能代表整个模型。模型解释方法处理的是一个比因果科学更窄的问题:在已经拟合的预测函数和明确的参考约定下,怎样把某一次预测相对于基线的变化分配给输入特征?SHAP 以合作博弈论中的 Shapley 值为基础,为这个问题提供统一的数学框架。
Read article →17如何使用 SimPy 模拟单服务台排队系统:离散事件仿真与等待时间分析
四位顾客分别在仿真时刻 0、1、2、3 到达一个容量为一的服务台,每次服务固定耗时两个时间单位。真实运行 SimPy 4.1.1 后,等待时间依次为 0、1、2、3,平均等待时间为 1.5,最大等待时间为 3,最后一位顾客在时刻 8 完成服务。以上数值已经通过原生程序执行、自然语言对话执行、CSV 结构检查以及独立语义校验。这个小型确定性案例既能人工逐项复核,又确实覆盖 Environment、Resource、生成器进程、资源请求和 timeout 等 SimPy 核心机制,因此适合作为离散事件仿真的可复现入门范例。
Read article →18如何使用 Psi4 TD-SCF 计算电子激发与紫外可见棒状光谱
科学原理导论 电子吸收光谱研究分子电子态之间的跃迁。线性响应含时方法在固定核几何构型上估计垂直激发能和跃迁强度。把能量换算为波长便于可视化,但计算得到的垂直棒线并不自动等于实验谱带峰值。理论方法、基组、几何、溶剂、振电结构、激发态性质和展宽都会影响与实验的比较。
Read article →19如何对组合分子库运行 Thompson Sampling 贝叶斯采样
科学原理导论 Thompson Sampling 是在不确定性下进行序贯决策的概率匹配策略。流程为每个行动或组分维护后验分布,每轮从后验抽取一个可能值,并评估该抽样世界中最有利的行动。反复执行后,它会在利用高估计回报与探索高不确定性选项之间取得平衡。在组合化学中,行动可以是试剂选择,回报可以来自实验或评分函数。
Read article →20如何使用 PyTorch Geometric 训练并验证图卷积网络
科学原理导论 图神经网络通过沿边传播信息,把节点属性与邻居信息组合为学习表示。图卷积网络反复聚合邻居特征、应用可训练变换,并生成可用于节点、边或整图预测的嵌入。评估特别容易发生泄漏,因为边会连接训练节点和留出节点,而且合成社区结构可能让标签异常容易恢复。
Read article →Häufig gestellte Fragen
Was ist MindPlot und wie funktioniert es?
MindPlot transforms complex datasets into publication-ready plots without coding. Upload your data, describe what you want, and get professional visualizations in one click.
Benötige ich Programmierkenntnisse, um MindPlot zu nutzen?
Keine Programmierung erforderlich! Mit unserer dialogorientierten Oberfläche erstellen Sie anspruchsvolle Visualisierungen in natürlicher Sprache – ideal für jedes Kenntnisniveau.
Was unterscheidet MindPlot und kann ich Plots anpassen?
Unser einzigartiges Multi-Agent-System ermöglicht die Echtzeit-Anpassung von Plots ohne langsame Neuverarbeitung. Passen Sie Stile, Farben und Layouts sofort über unsere dialogorientierte Oberfläche an.
What chart and plot types can MindPlot make?
MindPlot generates publication-ready scientific charts of every kind — Kaplan-Meier survival curves, meta-analysis forest plots, volcano plots, correlation-matrix heatmaps, ROC curves, box, violin and beeswarm plots, regression, scatter and PCA plots, and more. Just upload a CSV and describe what you need.
Sind meine Daten sicher? Verwenden Sie sie zum Trainieren von Modellen?
Der Schutz deiner Daten hat für uns Priorität. Wir verwenden deine Daten NICHT, um unsere Modelle zu trainieren. Die gesamte Verarbeitung ist sicher und vertraulich.
MindPlot® AI Scientific Data Toolkit
MindPlot® is an AI co-scientist for the entire research workflow — read, analyze, write, visualize, and present. Our unified suite (MindReader, MindChat, MindSheet, MindWriter, MindPlot, MindChart, MindDraw, MindFlow, MindVector, MindSlide, MindNote) helps researchers go from papers and raw data to publication-quality results in one place.
The Complete AI Research Suite
- MindReader: AI paper reader and literature summarizer — upload PDFs to summarize methods, extract findings, and translate.
- MindChat: One AI chat for ChatGPT, Claude, Gemini, and DeepSeek — switch models mid-conversation, pay per token.
- MindSheet: AI spreadsheet to clean, transform, and analyze research data with natural language — no formulas required.
- MindWriter: AI academic writing assistant for drafting papers, grants, and latex manuscripts.
- MindPlot: Publication-quality scientific static plots (Matplotlib/Seaborn) with APA/Nature styling — Kaplan-Meier survival curves, forest plots, volcano plots, heatmaps, box & violin plots, and more.
- MindChart: Interactive data exploration charts (ECharts) for presentations and web sharing — correlation matrix heatmaps, ROC curves, regression and time-series plots.
- MindDraw: Scientific illustration generator for graphical abstracts and mechanism diagrams.
- MindFlow: AI diagramming tool for research workflows, process maps, and experiment logic.
- MindVector: AI vector graphics editor for figures, scientific diagrams, and editable SVG artwork.
- MindSlide: AI presentation maker for academic talks, lab meetings, and thesis defense slides.
- MindNote: AI knowledge hub that captures and links your papers, chats, and figures into a searchable second brain.
Key Capability: Publication-Ready Scientific Visualization
- Automated statistical analysis (t-test, ANOVA) integrated with visualization
- High-DPI exports (300dpi+) for journal submission (PDF, SVG, PNG, EPS)
- Strict adherence to academic styling guidelines (APA, Nature, Science)
Scientific Chart & Plot Types We Generate
Describe your data and MindPlot's AI builds the exact chart you need: Kaplan-Meier survival curves and survival-plot generators, meta-analysis forest plots, volcano plots for differential expression, correlation-matrix heatmaps, ROC curves, box, violin, beeswarm and density plots, regression and scatter plots, PCA plots, dendrograms, and confusion matrices — all publication-ready, no coding.
- Kaplan-Meier survival curve generator (survival analysis, log-rank)
- Forest plot maker for meta-analysis and effect sizes
- Volcano plot generator for RNA-seq and proteomics
- Heatmap and correlation-matrix generator (CSV to heatmap)
- Box, violin, and beeswarm plots with built-in statistical tests
- ROC curves, regression plots, and confusion matrices
- CSV to chart in one click — upload data, get a figure
Trusted by Scientists Worldwide
- Akademische Forschung und wissenschaftliche Publikationen
- Biomedizinische und pharmazeutische Forschung
- Umweltwissenschaft und Klimaforschung
- Sozialwissenschaften und Psychologie
- Ingenieurwesen und technische Analyse
- Business Intelligence und Marktforschung
- Qualitätskontrolle und Fertigung
- Finanzanalyse und Berichtswesen
Über Cosinx AI
Developed by Cosinx AI, a leading artificial intelligence company specializing in scientific visualization and drug discovery. Our mission is to democratize data science and make advanced analytics accessible to researchers and professionals across all disciplines.


